AWS S3 vs Google Cloud vs Azure:
Cloud Storage Performance
I’m building a new cloud product that quickly processes large amounts of scientific data. Our largest customer dataset so far is about 3,000 tables, each 40 to 80 MB and totaling 150 GB, which we aim to process in 10 seconds or less. Each table can be processed independently, so we parallelize heavily to reach this goal — our deployment uses 1000 vCPUs or more as needed. The tricky part is rapidly reading that much data into memory. Right now about 80% of the computation time is spent reading data, and that leads to the focus of this three-part post: cloud storage performance. As part of solving this problem, I evaluated a few different approaches: object storage, database-backed storage and attached storage, each of which I’ll be detailing in separate posts.
Midway through writing this, Google happened to released their multi-cloud PerfKitBenchmarker. As far as I can find, this post is also the first set of published results from PerfKitBenchmarker.
Part 1: Object Storage
Obligatory notice: Benchmarks are application-specific and vary based on network load, neighboring VM activity, the month in which you were born and phase of the moon. When reading this, consider if these benchmarks are relevant to your application and understand that these results may not be reflective of what you will experience.
Object storage (Amazon AWS Simple Storage Service (S3), Google Cloud Storage (GCS), Microsoft Azure Storage) provides a simple PUT/GET/HEAD/LIST interface for storing any sort of data too large to put into a database. It is appealing because it is cheap, provides safety through redundancy and scales automatically to serve many concurrent requests. The downsides are the latency (in part from establishing a new HTTP connection for every file) and the throughput being limited by the network throughput and availability.
downloads
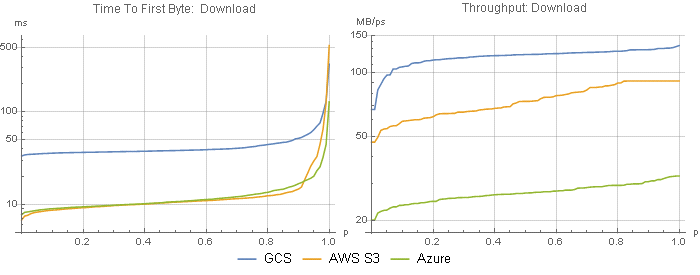
I looked at two key metrics: time to first byte (TTFB) to measure latency, and throughput (Figure 1), when downloading files from a VM hosted by the same vendor in the same region. In these plots, the percentile (or quantile) is on the x axis, and the metric is on the y (note the log scale), so you can see the typical response (median, 0.5) as well as the best and worst case behaviors.
|
|
Azure and AWS S3 gave essentially the same latency, whereas GCS averaged more than three times higher latency. However, Google provided approximately 4x the throughput of Azure and approximately 2x the throughput of S3. Thus, GCS should finish downloading sooner than Azure for files larger than ~1 MB and sooner than S3 for files larger than 5 MB. (Emphasis on finish downloading. If your application can handle streaming input and is processing the data slower than the data is being downloaded, then S3 and Azure will perform better for any file size.)
See that unnaturally flat right-tail on AWS S3 at 91 MB/s (732 Mbps)? I bet that’s the maximum throughput enforced by AWS.
network throughput caps are problematic
Network throughput is core to these benchmarks, and thus VM type must be considered when designing an architecture. Above I’m showing results from VM types that have sufficient network bandwidth to accurately measure storage throughput as opposed to VM throughput. I’ll go into network throughput in detail in a future post, but for now looking at Figure 2 you can see that for GCE and Azure a 1 vCPU machine provides sufficient throughput, whereas AWS EC2 requires a much larger machine — an 8 vCPU c4.2xlarge would have sufficed, but I used a 16 vCPU c4.4xlarge.
Few EC2 instance types have sufficient network throughput to make S3’s throughput the bottleneck if you were to download one file per vCPU (i.e. divide network bandwidth by vCPU count, which is a crude but useful view; Figure 2-right). Google Compute Engine on the other hand has much higher network throughput such that most machine types have more bandwidth than GCS, even despite GCS having higher throughput than S3. Azure’s low throughput is accommodated by most of their instance types as well.
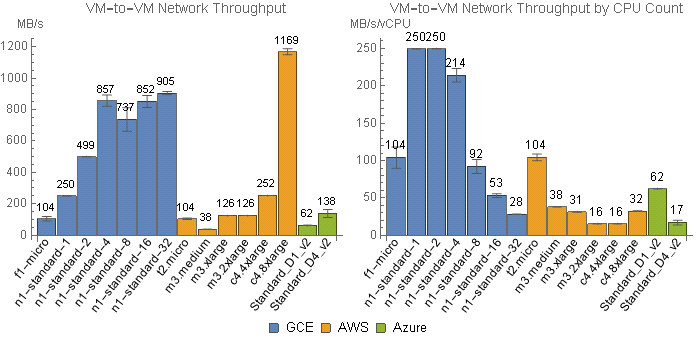
To be thorough, I did run the storage benchmarks on 16 vCPU instances from GCE (n1-standard-16) and Azure (D5_v2), and a 1 vCPU instance from AWS (m3.medium). Interestingly, the smaller VMs from Google and Microsoft had slightly higher storage throughput than the larger VMs (not shown), possibly because of how VMs are distributed on shared hardware. AWS’s m3.medium was tightly capped at 32.5 MB/s.
GCS multi-region buckets rock
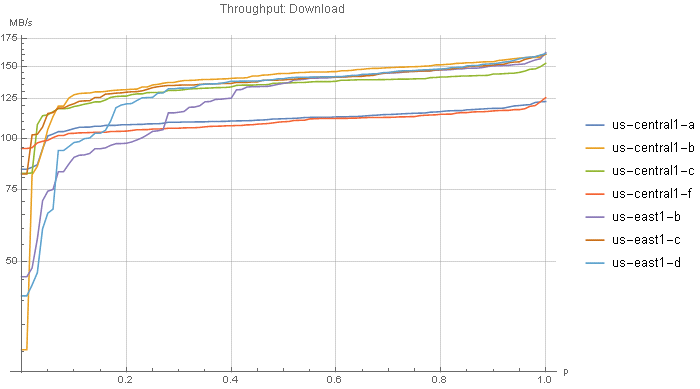
The GCS results in Figure 1 are for a US “multi-region” bucket. S3 has no multi-region buckets; S3 buckets are actually equivalent to GCS regional buckets. In contrast, multi-region buckets allow access from that set of regions without data transfer charges or duplication costs. (AWS charges $0.02 per GB for accessing a bucket from another region.) This is ideal if you have data processing servers in multiple regions. The throughput from both (…all two!) US data centers is excellent (Figure 3). I can't find anything useful in the terms of service, but I suspect multi-region buckets are more fault-tolerant as well.
The docs in the above link suggest that a regional bucket will provide lower latency and higher throughput than a multi-region bucket, so I also tested a us-central1 regional bucket from all four us-central1 compute engine zones (Figure 4), and a GCS us-east1 regional bucket from all three us-east1 zones (Figure 5), to see if we can get even faster throughput or improve GCS’s poor latency.
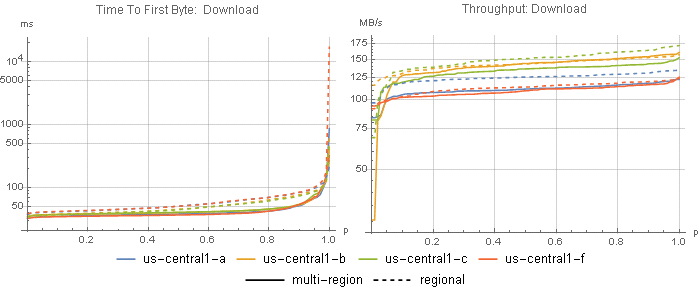
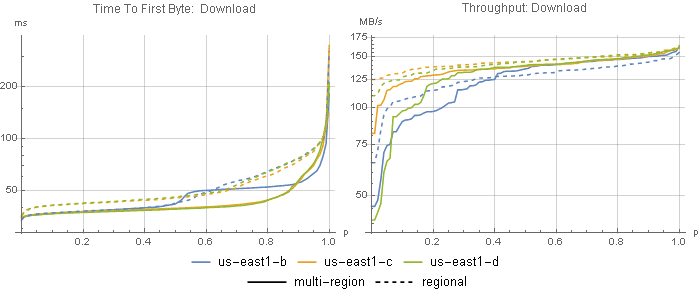
With regional buckets, latency somehow increased. Median throughput was either the same or slightly higher with regional buckets, although the tails were typically worse. Odd.
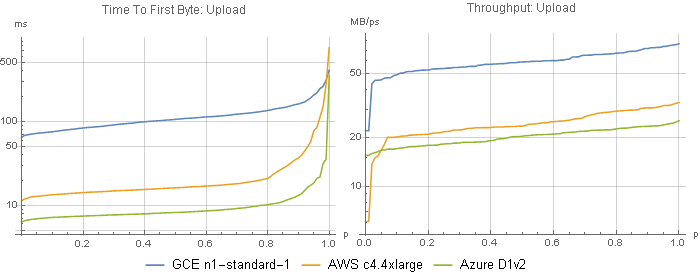
uploads
For my application I don’t depend on fast uploads, but I’m including some of the benchmark results here for completeness (Figure 6). Similar to downloads, Google had higher latency but faster throughput, Microsoft had the lowest latency and lowest throughput, and AWS was in the middle for both.
|
|
object storage handles concurrency well
Finally, Google’s gsutil includes a perfdiag command, and because it’s built on boto it can actually be used for both GCS and S3. This tool includes the ability to read or write multiple objects at once, which adds some new information to the story (Table 3). This shows that these platforms scale well to serve concurrent requests at the scale that we would be using them.
| Concurrency | GCS | S3 | ||
|---|---|---|---|---|
| Read (MB/s) | Write (MB/S) | Read (MB/s) | Write (MB/S) | |
| 1 | 113 | 34 | 61 | 20 |
| 5 | 480 | 156 | 306 | 87 |
| 10 | 641 | 284 | 520 | 128 |
| 20 | 845 | 588 | 603 | 141 |
conclusions
- Amazon and Azure provide the lowest latency, while Google provides the highest throughput, for both uploads and downloads. This means that AWS and Azure excel for smaller files, while GCE excels for larger files, and this highlights the importance of benchmarking with data that are comparable in size to what your application uses.
- The substantial limitations on AWS EC2 network throughput must be taken into consideration when designing high-speed data processing systems.
- Google's unique multi-region buckets keep costs down when working with data from multiple datacenters in the same region (e.g. continent).
- Object storage scales automatically to provide high aggregate throughput.
- Finally, note that I’m only showing data from API access (which is the exact same boto code for AWS and Google), and I have unsurprisingly observed substantial differences in performance from different clients (the vendor-specific CLIs, node.js API package, cURL’ing URLs, etc.).
Stay tuned for parts two and three on data storage, and future posts on other cloud performance metrics.
- http://googlecloudplatform.blogspot.com/2015/11/bringing-you-more-flexibility-and-better-Cloud-Networking-performance-GA-of-HTTPS-Load-Balancing-and-Akamai-joins-CDN-Interconnect.html
- http://docs.aws.amazon.com/AWSEC2/latest/UserGuide/ebs-ec2-config.html. While EBS-optimized instances have separate NICs dedicated to EBS, from my own testing these values seem to be the same as the limits found on the non-EBS NIC. There are some inconsistencies between what I measured and this page; for example, an m3.xlarge should have a limit of 62.5 MB/s, but I observed 126 MB/s, which is their reported limit for an m3.2xlarge. I wouldn’t be surprised if this was a botched AWS config setting. Same goes for the t2.micro’s high network performance, which contradicts what others (such as http://www.azavea.com/blogs/labs/2015/01/selecting-a-nat-instance-size-on-ec2/) have reported. More on network throughput in a future blog post!